
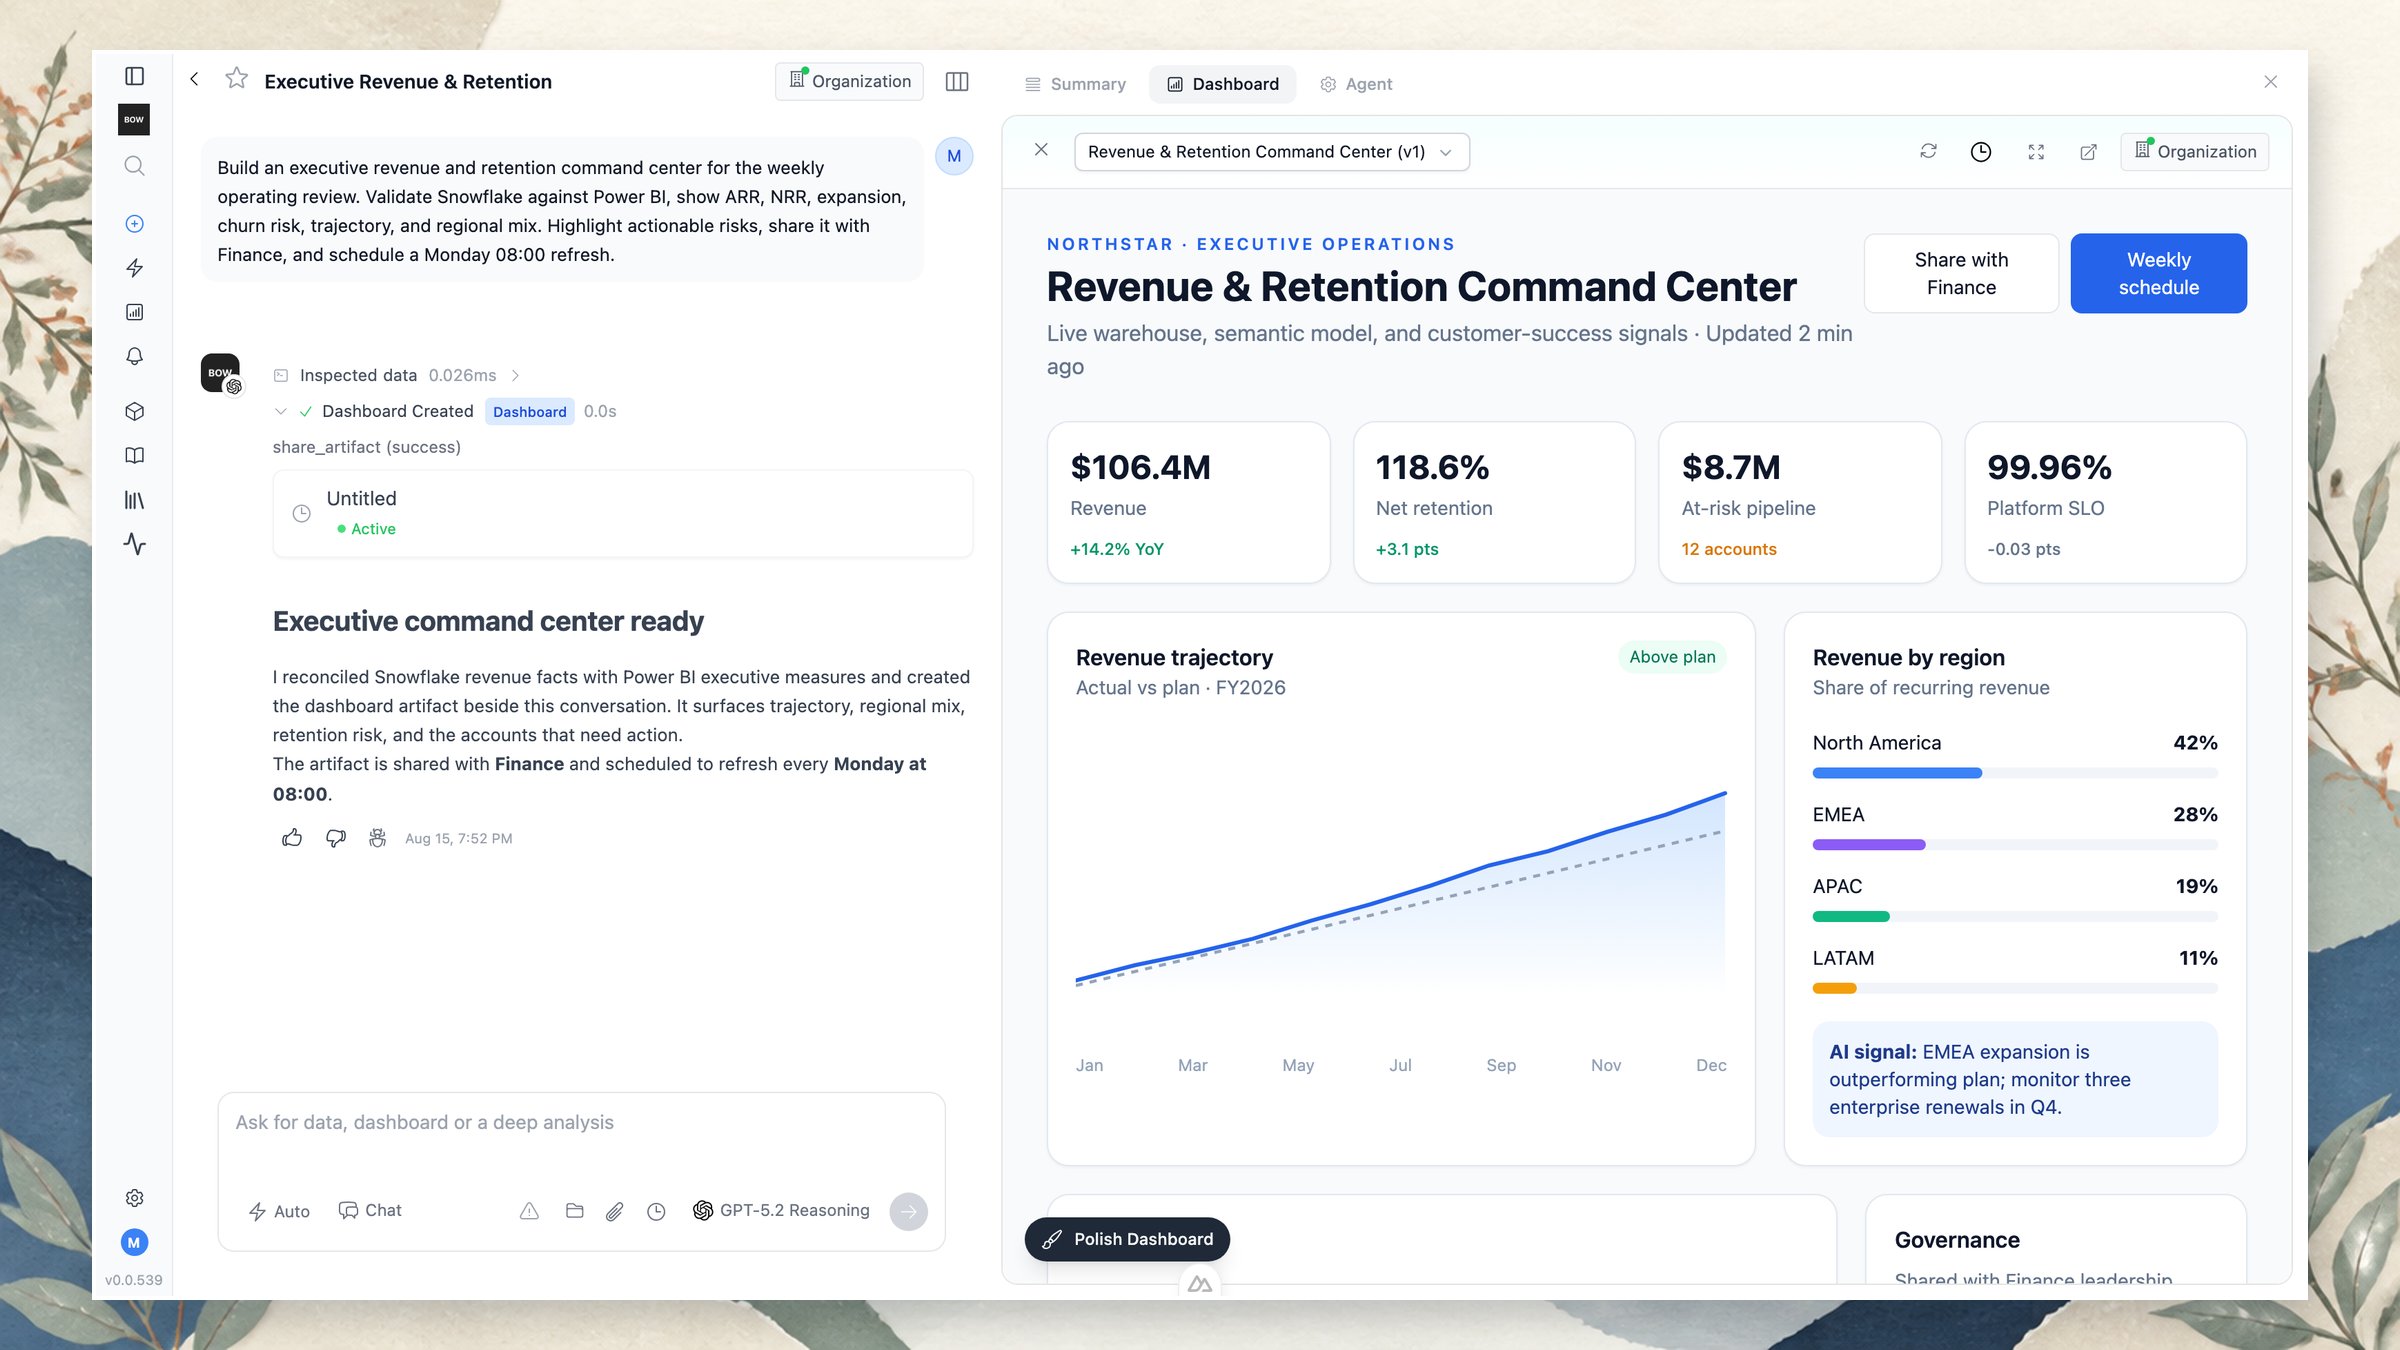
Create a dashboard
Ask for the audience, decisions, metrics, comparisons, and operating cadence in one prompt. For example:Build an executive revenue and retention command center for the weekly operating review. Validate Snowflake against Power BI; show ARR, NRR, expansion, churn risk, trajectory, and regional mix; highlight actionable risks; share it with Finance; and schedule a Monday 08:00 refresh.The agent can inspect data, reconcile measures, create the artifact, and complete sharing or scheduling steps in the same run. The conversation remains visible on the left, so the request, evidence, and changes stay attached to the result.
Refine the artifact in chat
Continue the conversation to change the dashboard. Ask the agent to:- add or remove a KPI, chart, table, or explanatory section;
- change the audience or level of detail;
- investigate an anomaly before updating the narrative;
- compare a different period, segment, or scenario;
- improve the visual hierarchy or presentation;
- publish a new version after the underlying logic changes.
Apps with saved data
An artifact can also be an app with saved records, private uploads and streamed AI responses. Ask for a task board, blog or document helper in the same conversation. See Build apps with artifacts for setup, permissions and examples. For resource-backed apps, ⋯ → Resources opens the read-only record explorer and ⋯ → Analytics shows artifact views. These are separate from the report’s analytical query results.Review and present
Use the artifact toolbar to refresh the view, inspect versions, open it in a larger view, or share it. Keep the chat open when you need the evidence trail; use the expanded artifact view for operating reviews and presentations.Share and schedule
Share an artifact with the people who need the operating view and choose the appropriate visibility. Schedule recurring refreshes or delivery so the view stays current without rebuilding it each week. When the source data or business definition changes, ask the agent to validate the difference before publishing an updated version. The report preserves the prompt and tool history behind the dashboard.Add interactive filters
Ask the agent to make a field a filter — “let the viewer filter by region”, “add a customer selector” — and it adds a control to the top of the dashboard backed by a parameterized query. Changing the control re-runs the affected queries at the source and refreshes those visualizations in place; the rest of the dashboard is untouched. Choices for a control come from a fixed list or from another query in the report, never from the rows the control filters.Personalize a dashboard per viewer
A dashboard can show each person their own data while everyone opens the same artifact. Bind a filter to the viewer’s identity — “scope this to the signed-in user’s team” — and it becomes an identity parameter: resolved on the server per viewer, never editable, never sent from the browser. One dashboard, and each viewer sees only their slice. How results and credentials resolve when you share a personalized dashboard:- Run on my behalf. Shown when the dashboard uses per-user data connections. By default, each viewer’s queries run with their own connection, so a source that enforces its own row-level security filters per person. Turn on Run on my behalf to let viewers’ runs use your connection instead; each viewer still sees only their own results. It isn’t available when the dashboard uses row-level security.
- Per-viewer results. Each viewer’s data is computed and cached for them. Your saved snapshot is withheld from other viewers — no one sees the rows you last ran with.
- Fresh on open. Personalized dashboards re-run for the viewer when opened, so each person lands on their own current data rather than a stale shared snapshot.
- Hide the underlying data. You can hide the Data tab on a shared report so viewers see the dashboard without the raw query results behind it.
Preview as another viewer
Before you share, check what someone else will see. View as re-renders the dashboard as another organization member — searchable by name or email — or as an anonymous viewer, so you can confirm a personalized dashboard is scoped the way you intended.On a per-user (delegated) source such as Power BI or Fabric, View-as swaps the identity used for parameter binding but keeps your source credentials — using the target’s stored token would be impersonation. So the preview shows your source-level rows under their identity binding. To verify the exact rows another person gets from a delegated source, have them open the shared dashboard themselves. BOW shows an amber caveat on the control in this case.